Let’s pick up where the previous post left off. I’ll take those moving averages and turn them into a trade signal. First, the same disclaimer applies.
Disclaimer
I am not licensed as a financial advisor by IIROC. The information provided on this website does not constitute investment advice, financial advice, trading advice, or any other sort of advice. Conduct your own due diligence before making any life altering or investment decisions.
1. Moving Averages as a Trade Signal
It seems that a sensible trade signal would be to take the difference between two moving averages, say the 50 day and the 20 day moving averages. Our signal then becomes:
signal = MA20 – MA50
When the signal is greater than zero we will buy, and when the signal is less than zero we will sell. Let’s see what this looked like over the past two years:
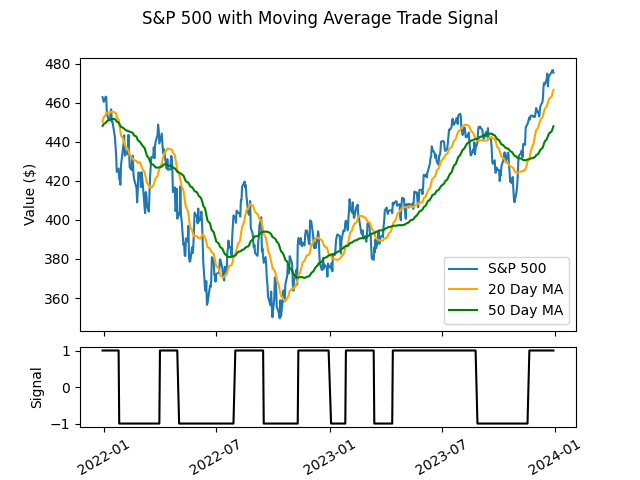
Look at me go! I just wrote my first automated trading system!
A natural question to ask is: does it work?
To answer that I will look at the performance over the last twenty years vs. a buy and hold strategy.
Assumptions:
- $1000 starting capital
- No commissions
- Only whole numbers of shares may be traded
- No cash is added during the study period
- Dividends are not considered
- No short selling
At the end of twenty years the Moving Average trading system came out with $2300. Compare this to simply buying and holding over the same time period, which would have produced a final value of $6187.
Before addressing where things go wrong, let’s do the same thing using Kalman Filters.
2. Kalman Filters as a Trade Signal
I will use Kalman filters with transition co-variances of 0.01 (short term average) and 0.001 (long term average). The signal then becomes:
signal = KF0.01 -KF0.001
The same rule applies, when the signal is greater than zero we will buy, and when the signal is less than zero we will sell. Let’s see what this looked like over the past two years:
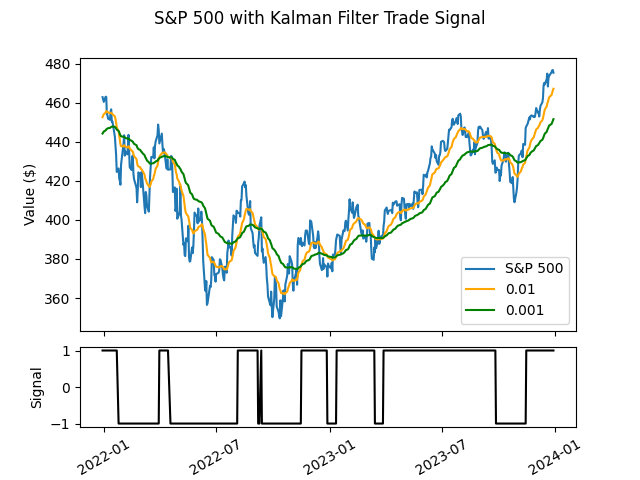
Using the same assumptions, the Kalman filter trading system came out with $3693 – better than the Moving Average, but still not as good as buy and hold.
3. Where do Things go Wrong?
The buy and hold strategy simply purchases 13 shares at the start of twenty years and holds on to them for the entire time. Both the Kalman filter and the moving average strategies are sometimes out of the market when it is rising – the result of this is when a buy signal is generated, the portfolio does not have enough cash to buy the same number of shares as was held previously. Both these strategies also introduce a lag – the buy signal is generated after the S&P 500 reaches the bottom, and the sell signal is generated after the S&P 500 reaches the top.
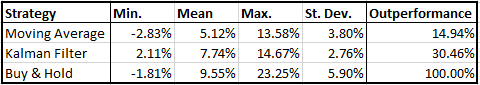
We can also look at the way annual returns are distributed for each strategy. To do this, I will start each strategy with $1000, and let it run for five years. The start date will be July 2004, with a new portfolio being started at the beginning of each month until January 2019.
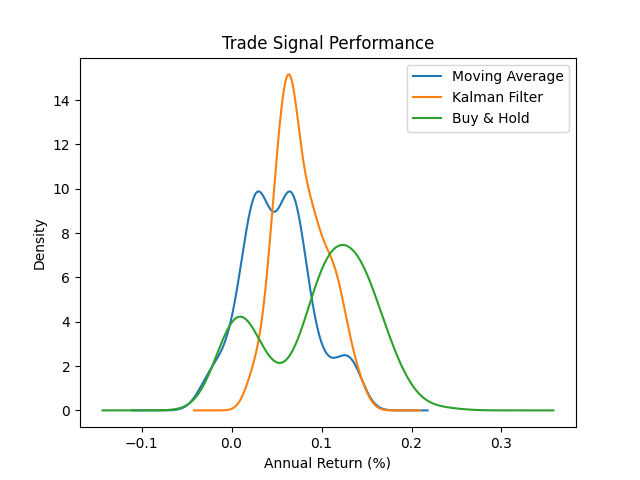
A few things to notice about this graph. The returns from a buy and hold strategy are bi-modal, with peaks at (roughly) 0% and 13%. The moving average strategy also has a bi-modal distribution, but the two peaks are close together at 5%. The Kalman filter strategy has a single peak at 7% and is more narrowly distributed than either the moving average or the buy and hold. Of all the portfolios, the moving average only outperformed buy and hold in 15% of cases; the Kalman filter did better, and outperformed buy and hold 30% of the time. The returns for each strategy are shown below:
4. Conclusion
Generating a trading signal that consistently beats a buy and hold strategy over long periods of time is going to be a challenge (kinda like a bunch of really smart people have already got the low hanging fruit, and most information is reflected in the price already); that is not going to stop me from trying though! Join me on this adventure through algorithmic trading!
In the next post, I will look at how to optimize the parameters of the two trade signals that were presented here.

Leave a comment