Disclaimer
The information provided on the website does not constitute investment advice, financial advice, trading advice, or any sort of other advice. Conduct your own due diligence before making any life altering or investment decisions.
Moving Averages
Moving averages are used in time series analysis to smooth a noisy signal and extract the long-term trend.
Mathematically, the moving average is computed as the unweighted mean of the previous n data points. The window length (n) selected depends on the type of movement that you are interested in (short, medium, or long term). Longer averaging periods result in a smoother signal (less high frequency noise) but at the cost of increased lag, and increased deviation between the original series and the smoothed series.
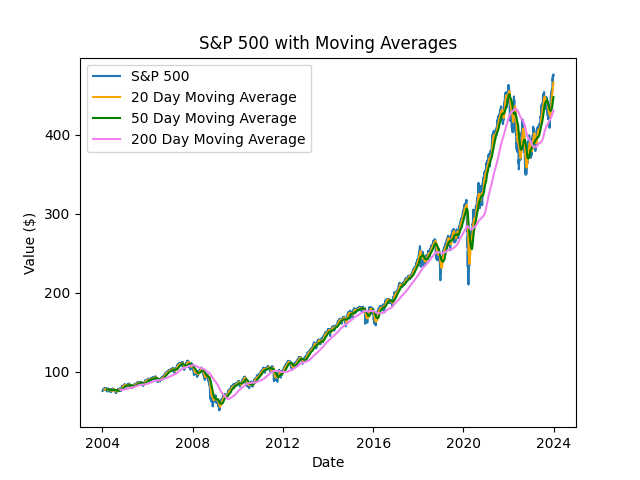
Lets take a look at the S&P 500 index over the last 20 years with 20, 50, and 200 day moving averages applied:
Lets zoom in on the last 2 years:
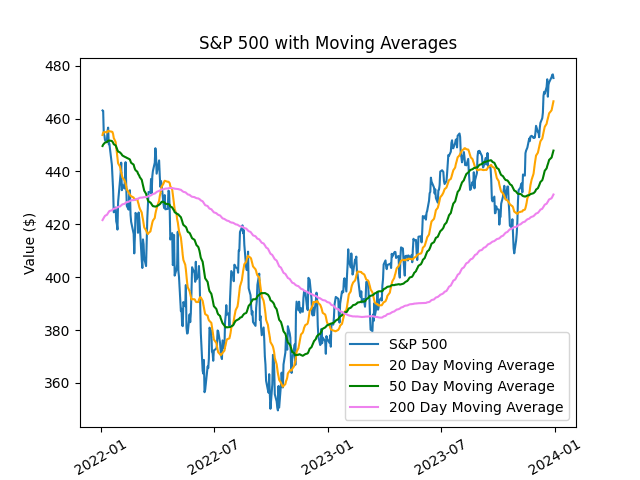
The 20 day moving average matches the original signal most closely, but is also the most volatile. The 200 day moving average is the smoothest, but deviates from the underlying signal most significantly.
Kalman Filters
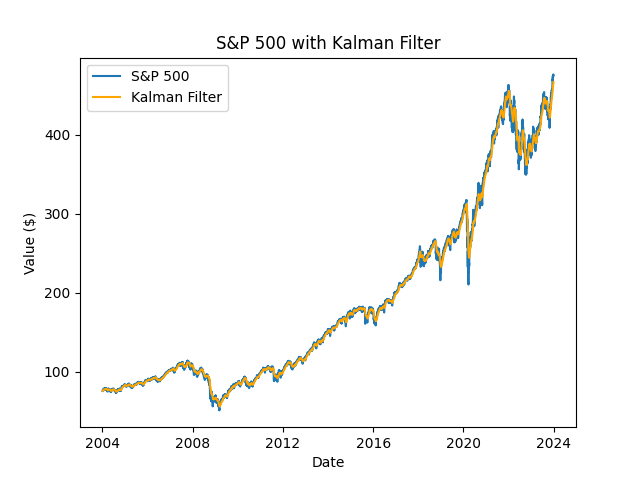
The Kalman filter is an alternative method for extracting a signal from noisy data. The algorithm works using two phases: a prediction phase, and an update phase. In the prediction phase, the state variables are estimated with their uncertainties. The estimate for the new state is then updated using a weighted average, where greater weight is given to measurements with greater certainty.
Lets take a look at the S&P 500 with a Kalman filter applied:
Lets zoom in on the last 2 years:
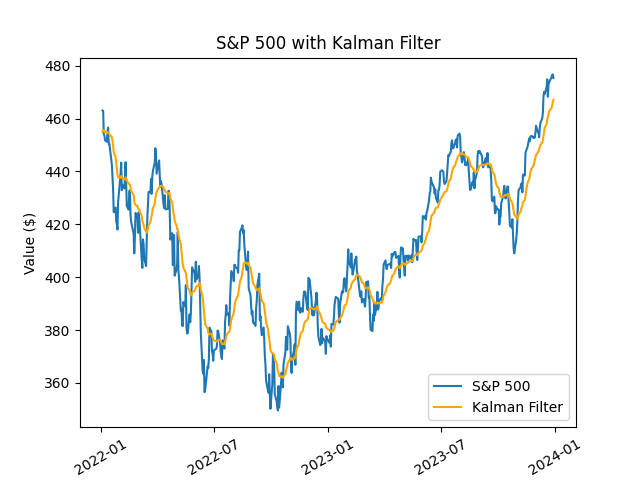
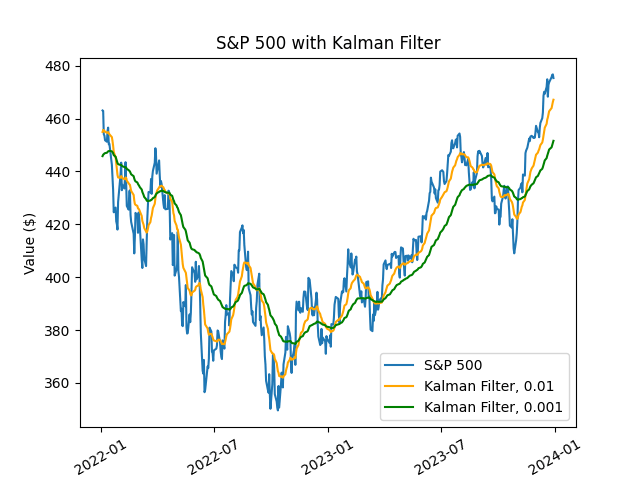
The performance of the filter depends on the parameter values that are chosen. The three parameters that affect filter performance are: initial state covariance, observation covariance, and transition covariance. The combination of these parameters results in a measurement of ‘gain’. A high gain will place more weight on recent measurements, resulting in a responsive filter that matches the underlying signal closely (like a short-term for a moving average); a low gain filter smooths out noise but decreases responsiveness (like a long-term moving average).
To see what this looks like, I’ll plot the last 2 years with Kalman Filters with transition co-variances of 0.01 and 0.001:
In the next post, I will turn both of these into a trade signal and evaluate how they perform against a buy and hold strategy.

Leave a comment