I’m back with an update on Pedestrian-Traffic Incidents for the month of August. The data is sourced from the City of Calgary’s open data website. The data set is here.
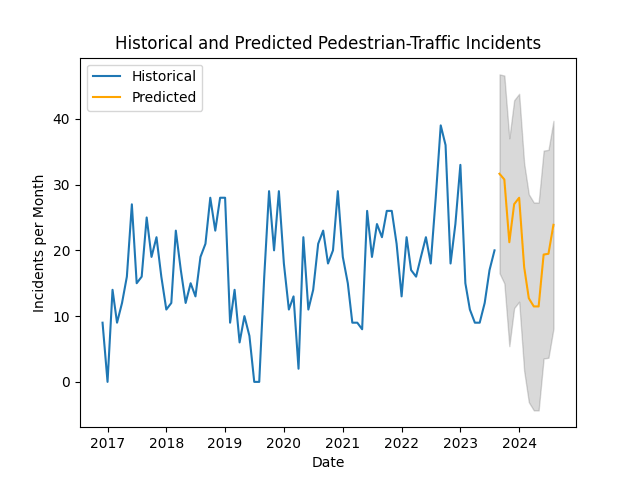
There were 20 incidents in August – 3 more than in July and 8 fewer than last August.
The heat map and cluster map are shown below:
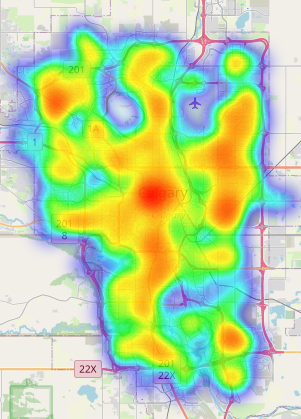
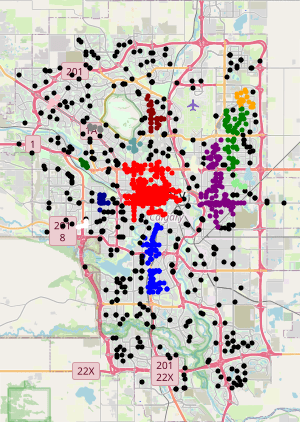
The major clusters of incidents (downtown, Macleod Trail, Forest Lawn, and the NE transit line) do not appear to be changing. The burgundy cluster near the 201/22X label has disappeared, I am not sure that all of the incidents are being plotted every month.
Model Details
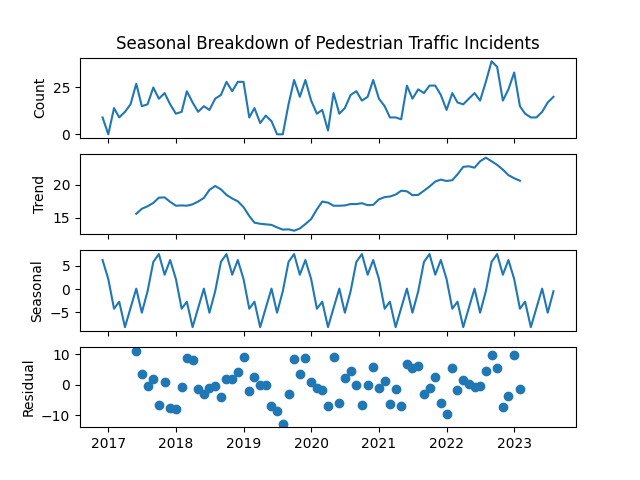
The model is a SARIMAX (Seasonal Auto-Regressive Integrated Moving Average eXogenous regressors). The model specification is (0, 1, 1)(0, 1, 1)[12]. An Error-Trend-Seasonal breakdown is shown below:
The regression diagnostics are shown below:
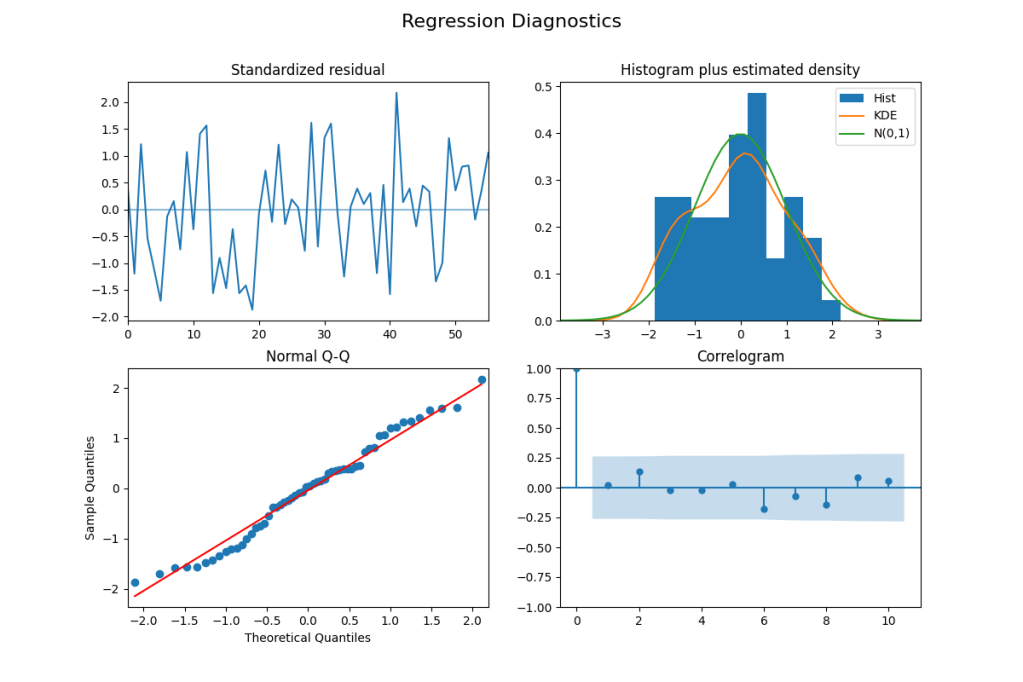
The regression diagnostics indicate that the model is not missing any major dynamics in the data. The standardized residuals are centered on zero, and do not show significant autocorrelation. As with last month, the residuals are more bimodal than in the past, this shows up in the histogram, and as a deviation from the linear pattern in the Q-Q plot at the -1 and +1 Theoretical Quantiles. None of the lags on the Correlogram are statistically significant.

Leave a comment