Once again, it has been a while since I posted about Pedestrian-Traffic Incidents; between a masters degree and a hard drive failure things have been busy. The data is sourced from the City of Calgary’s open data website. The data set is here.
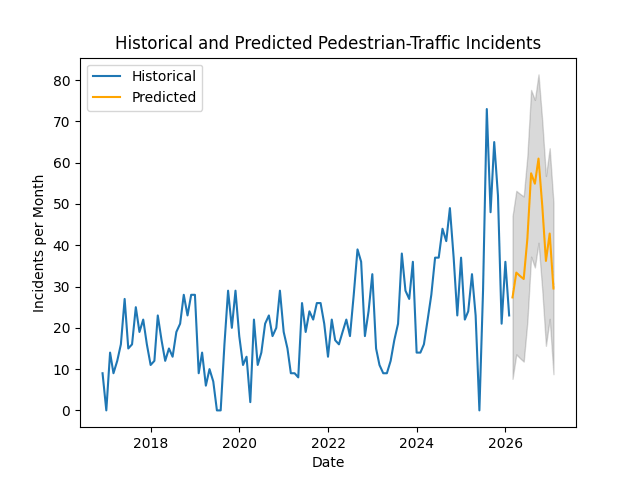
There were 23 incidents in February – 13 more than January and 1 more than last February. After a bit of a spike at the end of 2025, it seems that incidents are back to a rate of about 1 per day.
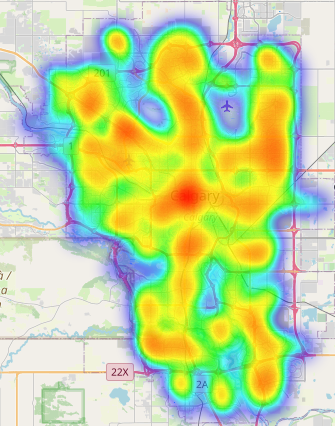
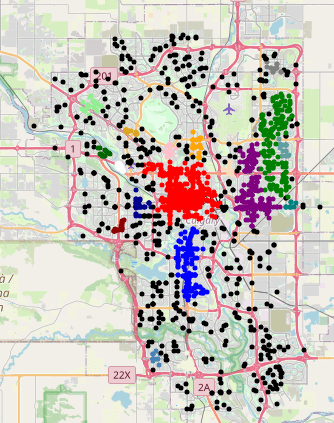
The heat map and cluster map are shown below:
Model Details
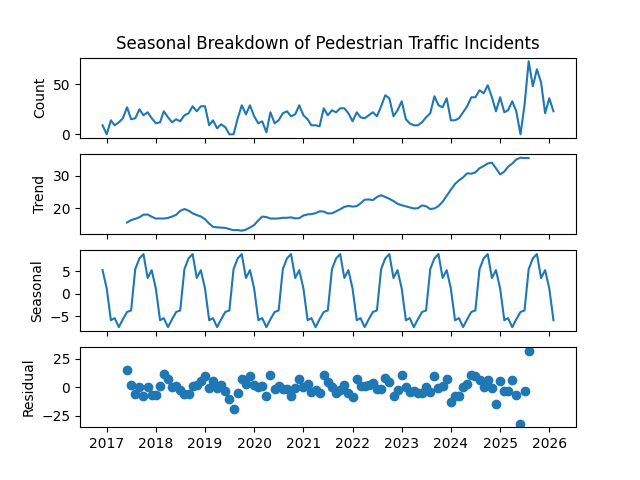
The model is a SARIMAX (Seasonal Auto-Regressive Integrated Moving Average eXogenous regressors). The model specification is (0, 1, 1)(0, 1, 1)[12]. An Error-Trend-Seasonal breakdown is shown below:
The regression diagnostics are shown below:
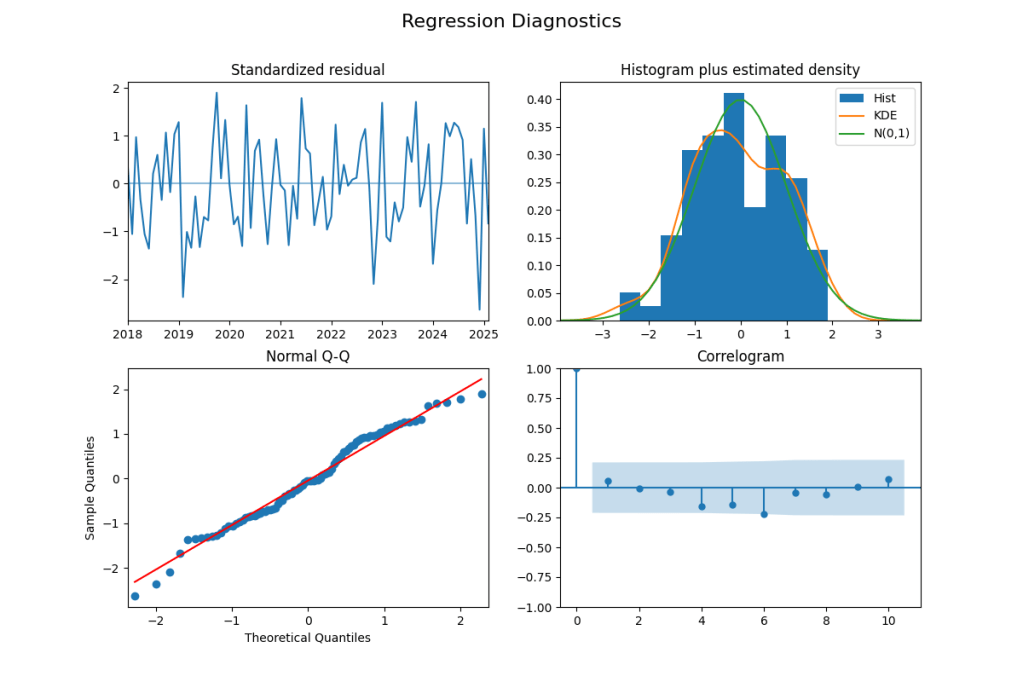
The regression diagnostics indicate that the model is not missing any
major dynamics in the data. The standardized residuals are centered on
zero, and do not show significant autocorrelation. The residuals are
more normal than in the past, this shows up in the histogram, and as a
smaller deviation from the linear pattern in the Q-Q plot at the -1 and
+1 Theoretical Quantiles. It looks like the 6 month lag may be significant, I will wait and see if this persists in future data.

Leave a comment