After a rather long hiatus I am back with more Pedestrian-Traffic Incidents. The data is sourced from the City of Calgary’s open data website. The data set is here.
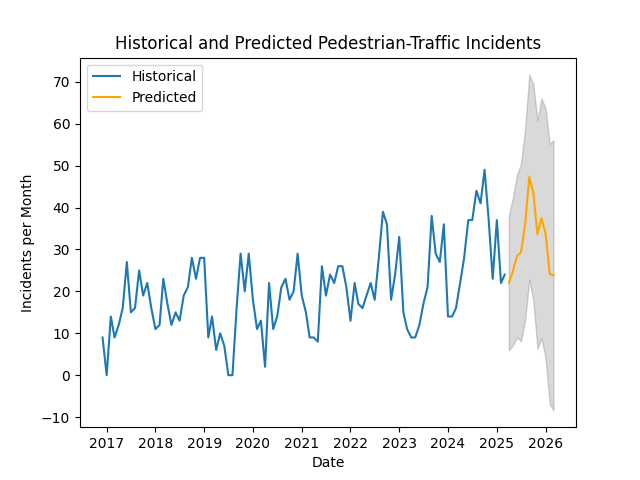
There were 24 incidents this March – 2 more than in February and 8 more than last March. While one point does not make a trend, a 50% year-over-year increase is concerning.
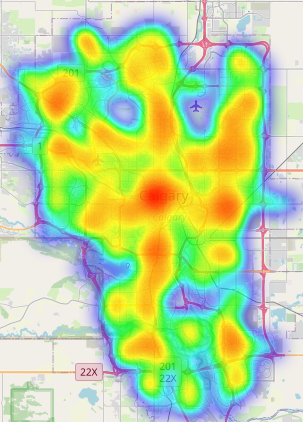
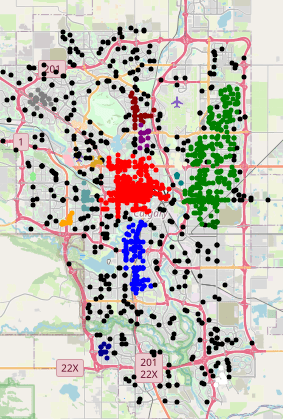
The heat map and cluster map are shown below:
The cluster map looks a little different this time around – I increased the distance parameter to produce fewer, but larger clusters
Model Details
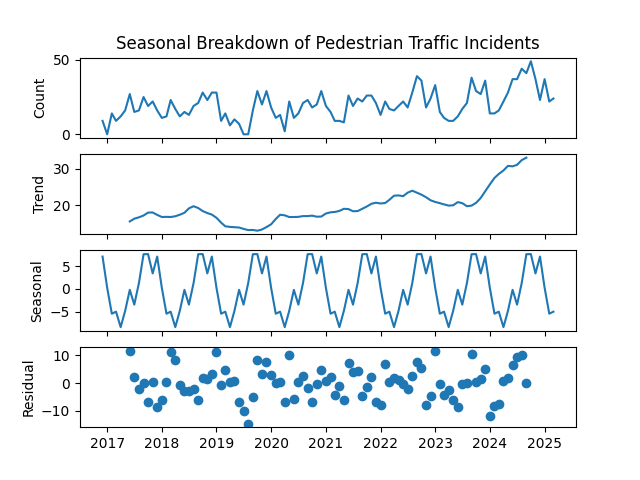
The model is a SARIMAX (Seasonal Auto-Regressive Integrated Moving Average eXogenous regressors). The model specification is (0, 1, 1)(0, 1, 1)[12]. An Error-Trend-Seasonal breakdown is shown below:
The regression diagnostics are shown below:
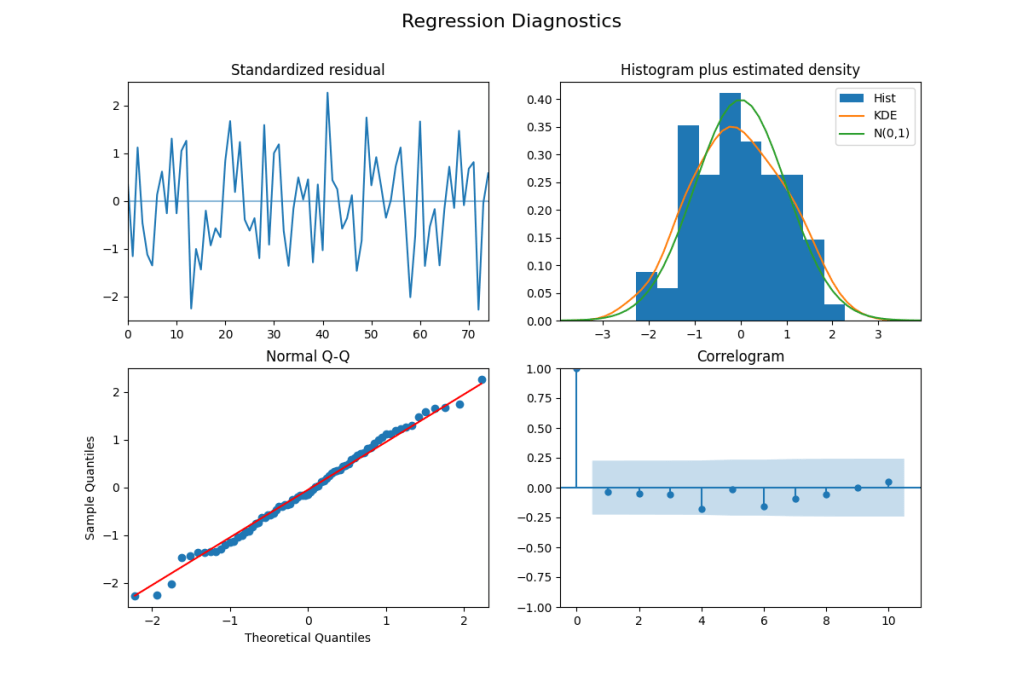
The regression diagnostics indicate that the model is not missing any
major dynamics in the data. The standardized residuals are centered on
zero, and do not show significant autocorrelation. The residuals are
more normal than in the past, this shows up in the histogram, and as a
smaller deviation from the linear pattern in the Q-Q plot at the -1 and
+1 Theoretical Quantiles. None of the lags on the Correlogram are
statistically significant.

Leave a comment