I’m back with an update on Pedestrian-Traffic Incidents for the month of March. The data is sourced from the City of Calgary’s open data website. The data set is here.
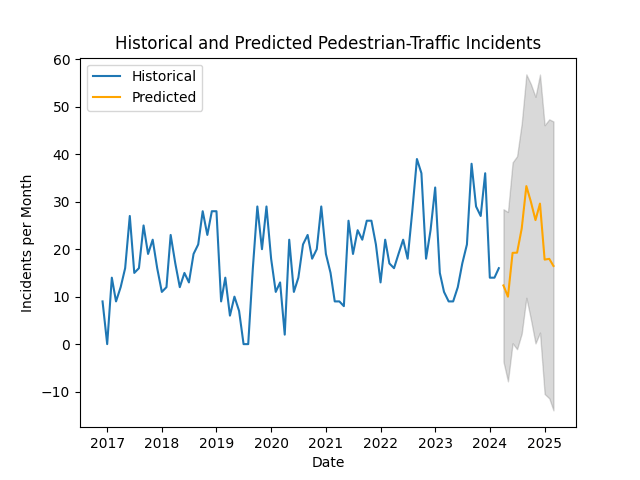
There were 16 incidents in March – 2 more than February, and 5 more than last March.
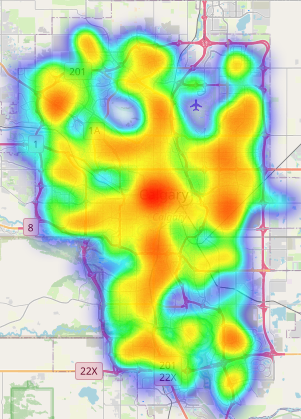
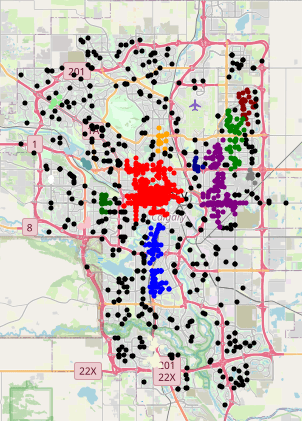
The heat map and cluster map are shown below:
Model Details
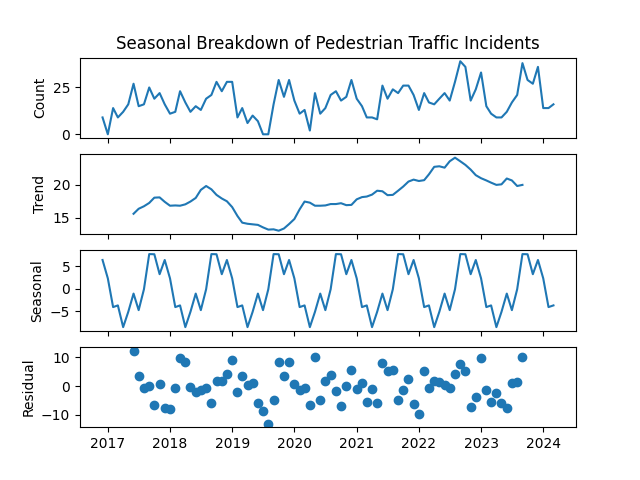
The model is a SARIMAX (Seasonal Auto-Regressive Integrated Moving Average eXogenous regressors). The model specification is (0, 1, 1)(0, 1, 1)[12]. An Error-Trend-Seasonal breakdown is shown below:
The regression diagnostics are shown below:
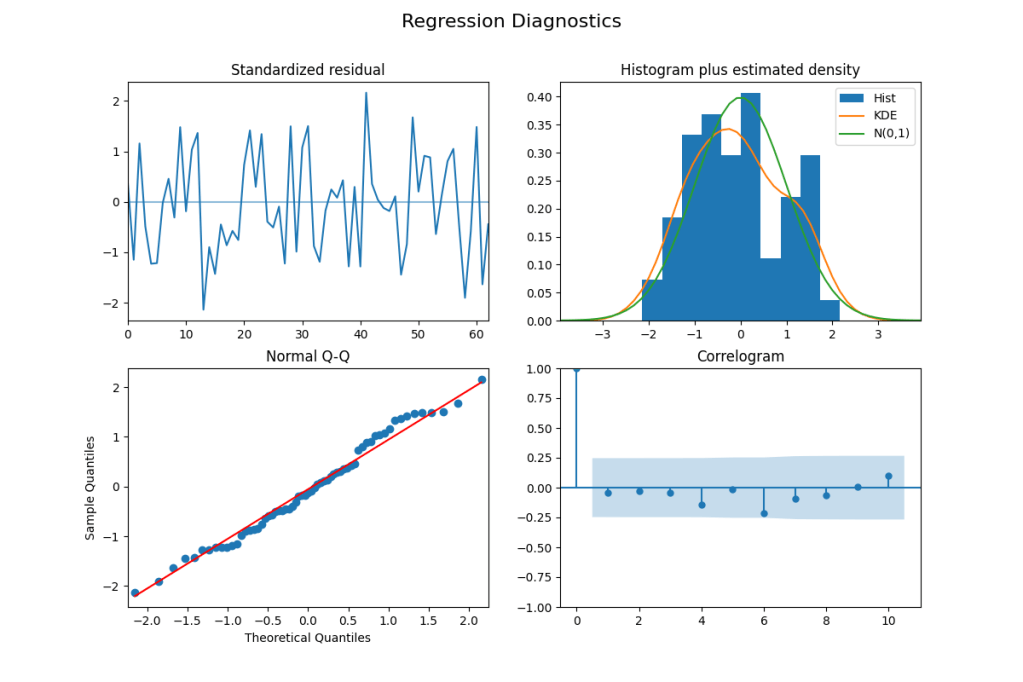
The regression diagnostics indicate that the model is not missing any major dynamics in the data. The standardized residuals are centered on zero, and do not show significant autocorrelation. As with last month, the residuals are more bimodal than in the past, this shows up in the histogram, and as a deviation from the linear pattern in the Q-Q plot at the -1 and +1 Theoretical Quantiles. None of the lags on the Correlogram are statistically significant.

Leave a comment