I’m back with an update on Pedestrian-Traffic Incidents for the month of June. The data is sourced from the City of Calgary’s open data website. The data set is here.

There were 12 incidents in June – 3 more than in May and 10 fewer than last June.
The heat map and cluster map are shown below:
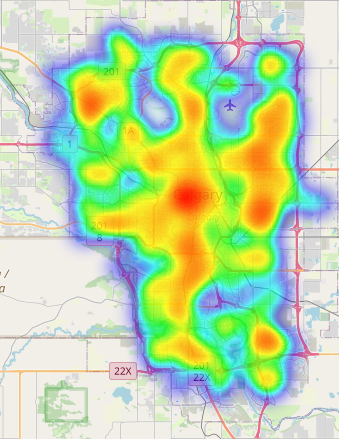
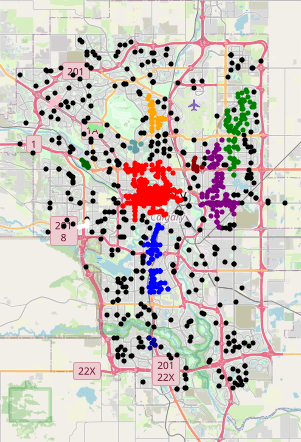
The clusters have changed a little bit, I wonder if there is some sort of seasonal variation in the location of incidents. There no longer appears to be a distinct cluster around the Somerset/Bridalwood LRT station – that might be an artifact of the data though.
Model Details
The model is a SARIMAX (Seasonal Auto-Regressive Integrated Moving Average eXogenous regressors). The model specification is (0, 1, 1)(0, 1, 1)[12]. An Error-Trend-Seasonal breakdown is shown below:
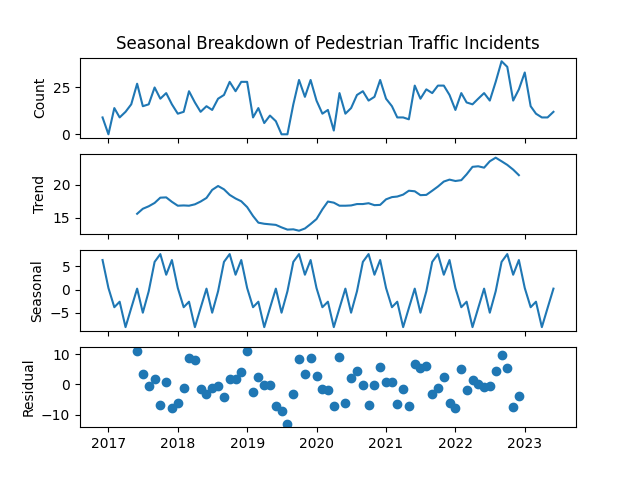
The trend component still appears to be moving downward – despite the uptick from last month, incidents are trending in the right direction.
The regression diagnostics are shown below:
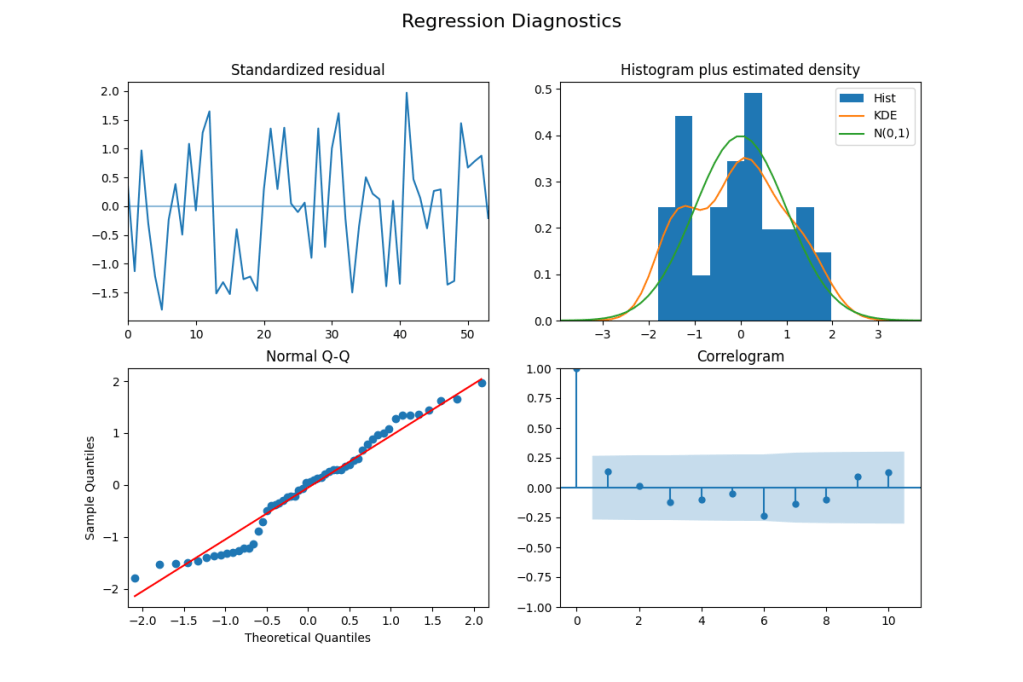
The regression diagnostics indicate that the model is not missing any major dynamics in the data. The standardized residuals are centered on zero, and do not show significant autocorrelation. As with last month, the residuals are more bimodal than in the past, this shows up in the histogram, and as a deviation from the linear pattern in the Q-Q plot at the -1 and +1 Theoretical Quantiles. None of the lags on the Correlogram are statistically significant.

Leave a comment