Inflation, and particularly changes in the cost of food have been big topics in the news recently. I have been tracking my spending on food since the start of 2021, so I figure that I will weigh in here with the data that I have collected.
Stats Canada
First, let’s see what Statistics Canada has to say. The data below is from Table 18-10-0004-01 Consumer Price Index, monthly, not seasonally adjusted
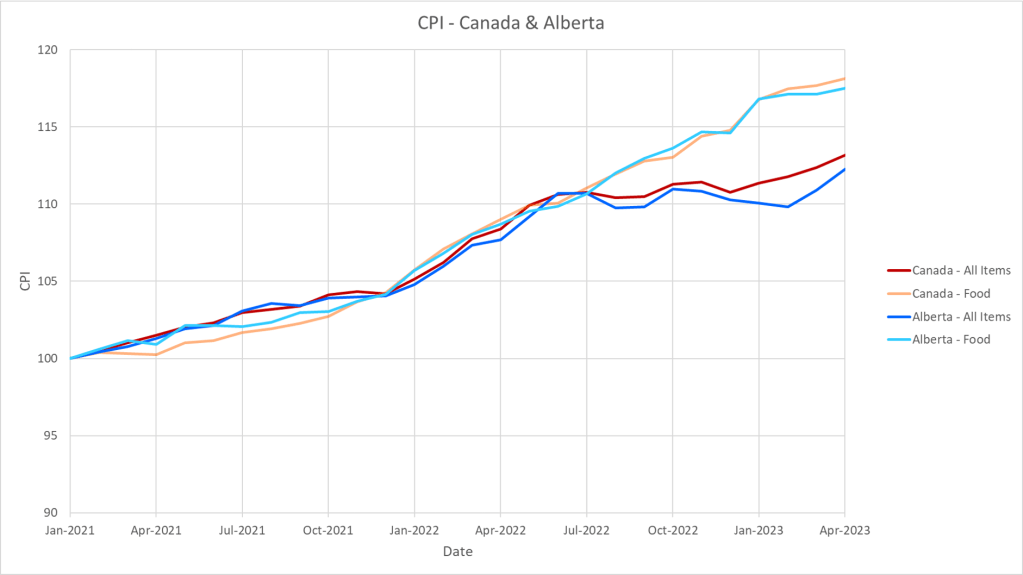
I have normalized all of the data to start at a base value of 100 in January 2021. Inflation seems to be in-line between Canada and Alberta, both in terms of All-Items and Food, but Food diverges significantly from All-Items in July 2022.
How does my data compare?
I have been collecting data on my food spending since the start of 2021. I collect the total cost of the recipe, then normalize by the number of servings. A few notes on the data collection process:
- As much as possible, I try to buy only what I need for each recipe; this is not always possible.
- I do not measure ingredients by weight, so there is some variation each time I make a given dish.
- I don’t really shop sales; if an ingredient that I need is on sale, I will gladly take the discount, but I do not actively plan menus around sales.
- The data is presented on a cost per serving basis. I do not think that I have changed serving sizes significantly over time, however, the number of servings (±1) can have a significant impact (±20%) on the cost per serving figure.
Lunches and dinners are split into separate data sets, both are presented below:


I don’t really see the same evidence of inflation in my own data that is apparent in the Statistics Canada data. The cost per serving in the dinner data set has actually decreased by about 20% over the last 2 years, although with a significant amount of variability. There is an element of psychology underlying this though: after making something expensive, I feel compelled to make a few low cost meals if only to bring the average cost back into some sort of line.
There is one pasta dish (Jool’s Pasta from Jamie Oliver) that I make regularly every 6 weeks. It provides a good cross section of the grocery store, and with making it regularly, I am more consistent on the ingredients and the proportions. I have broken out the costs of this one separately:
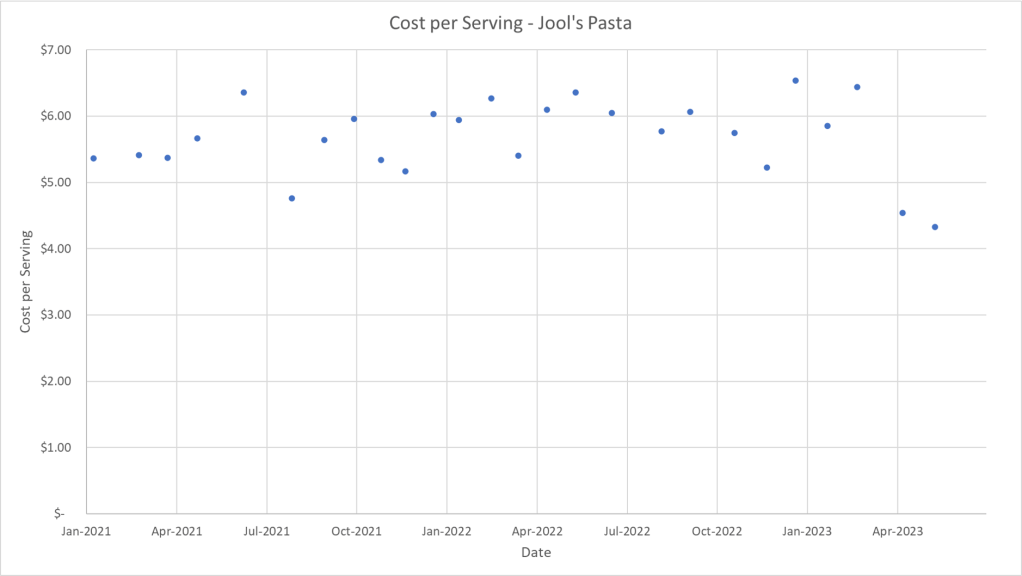
The cost per serving for this one was rising reliably until March of 2023 – then one of the local grocery stores closed. That store tended to carry higher quality ingredients. You can see the drop in cost per serving beginning in April 2023.
I’ll wrap up this post by comparing my data directly to the Statistics Canada data. The following chart compares the normalized meal cost (1 January 2021 = 100) to the Alberta CPI for food:
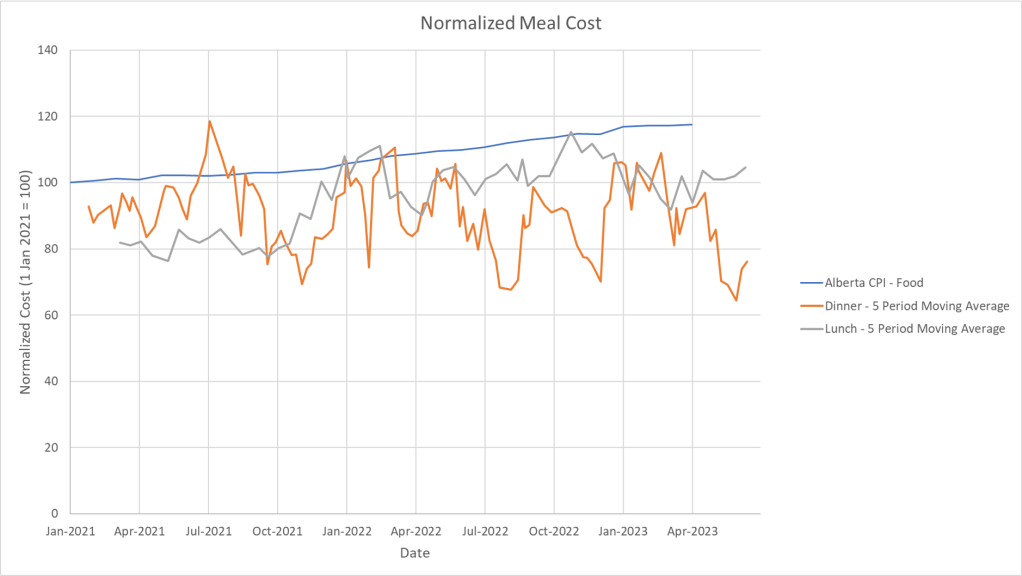
Note: those are the 5 period moving averages for lunch and dinner. They do not necessarily start at 100 (the first meal of the data set was normalized to have a cost of 100), and they do not start on January 1, 2021 – the moving average for the lunch data set starts in March 2021.
Conclusion
I do not see the same amount of inflation that Statistics Canada is seeing in food costs, even when comparing the data in a few different ways. My data set is complicated by significant variation in costs from meal to meal, psychological factors, and store closures.
This might become a regular post; if it does, I will transition the analysis into python.

Leave a comment