I’m back with an update on Pedestrian-Traffic Incidents for the month of April. The data is sourced from the City of Calgary’s open data website. The data set is here.
There were 8 incidents in May – 1 less than in April and 11 less than last May.
The heat map and cluster map are shown below:
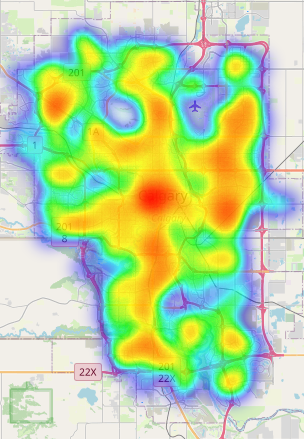
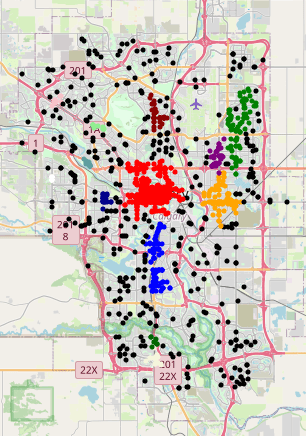
In addition to the distinct clusters in downtown (red), Forest Lawn (orange), along the Northeast transit line (green), and Macleod Trail (blue), there is also a beige cluster at the South end of the map – this is near the Somerset/Bridalwood LRT station, and the associated shopping complex.
Model Details
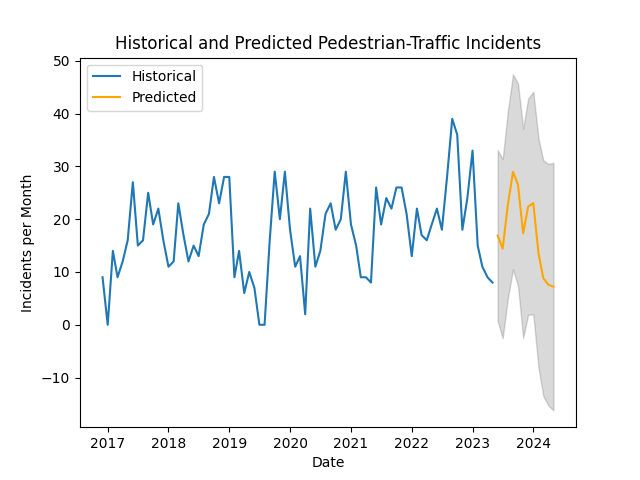
The model is a SARIMAX (Seasonal Auto-Regressive Integrated Moving Average eXogenous regressors). The model specification is (0, 1, 1)(0, 1, 1)[12]. An Error-Trend-Seasonal breakdown is shown below:

The trend component of the breakdown looks like it is moving downward – well done everyone for paying attention while driving and walking.
The regression diagnostics are shown below:

The regression diagnostics indicate that the model is not missing any major dynamics in the data. The standardized residuals are centered on zero, and do not show significant autocorrelation. As with last month, the residuals are more bimodal than in the past, this shows up in the histogram, and as a deviation from the linear pattern in the Q-Q plot at the -1 and +1 Theoretical Quantiles. None of the lags on the Correlogram are statistically significant.

Leave a comment