I’m back with an update on Pedestrian-Traffic Incidents for the month of November. The data is sourced from the City of Calgary’s open data website. The data set is here.
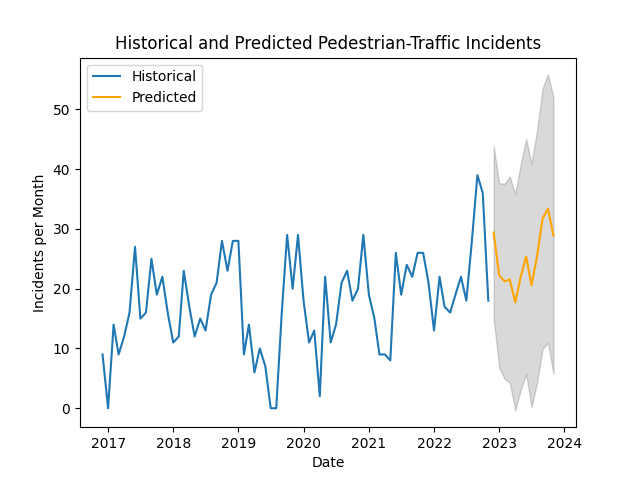
There were 18 incidents in November – half the number of incidents in October, and down 8 from November 2021.
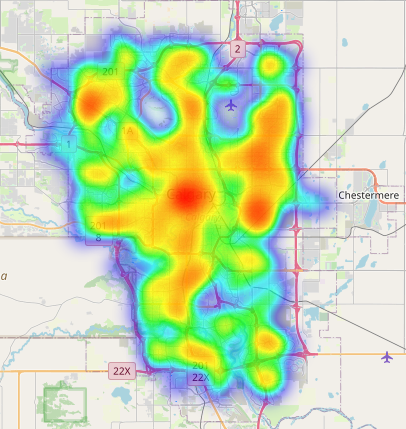
In addition to the heat map, I have added a cluster map to the analysis. The clustering algorithm that I am using is DBSCAN (Density-Based Spatial Clustering of Applications with Noise).
The latitude and longitude data are first scaled using the standard scaler from python’s sklearn library, then clusters are found using DBSCAN with eps=0.12 and a minimum cluster size of 8. DBSCAN works by choosing a point, then finding all points that can be connected to that point by making a jump of no more than eps (0.12 in this case). Points that can not be reached in this way are assigned to ‘noise’ – shown as the black points in the cluster map.
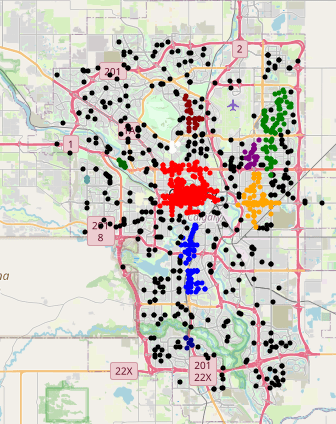
The cluster map shows that in addition to the cluster of incidents downtown, there are distinct clusters in the Forest Lawn (orange), along the Northeast transit line (green), and along Macleod Trail (blue).
Model Details
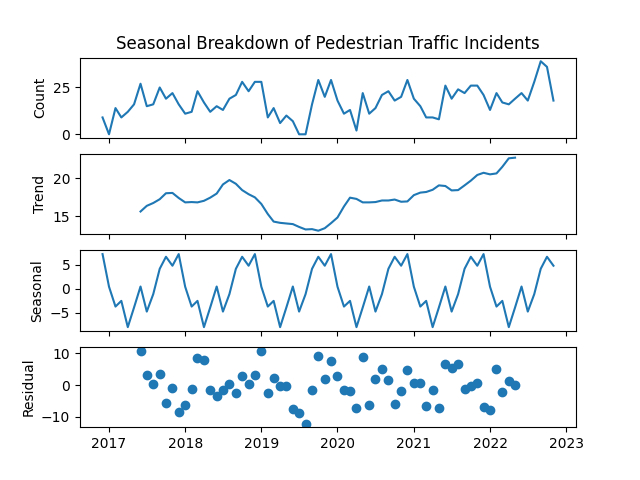
The model is a SARIMAX (Seasonal Auto-Regressive Integrated Moving Average eXogenous regressors). The model specification is (0, 1, 1)(0, 1, 1)[12]. An Error-Trend-Seasonal breakdown is shown below:
Regression diagnostics are shown below:
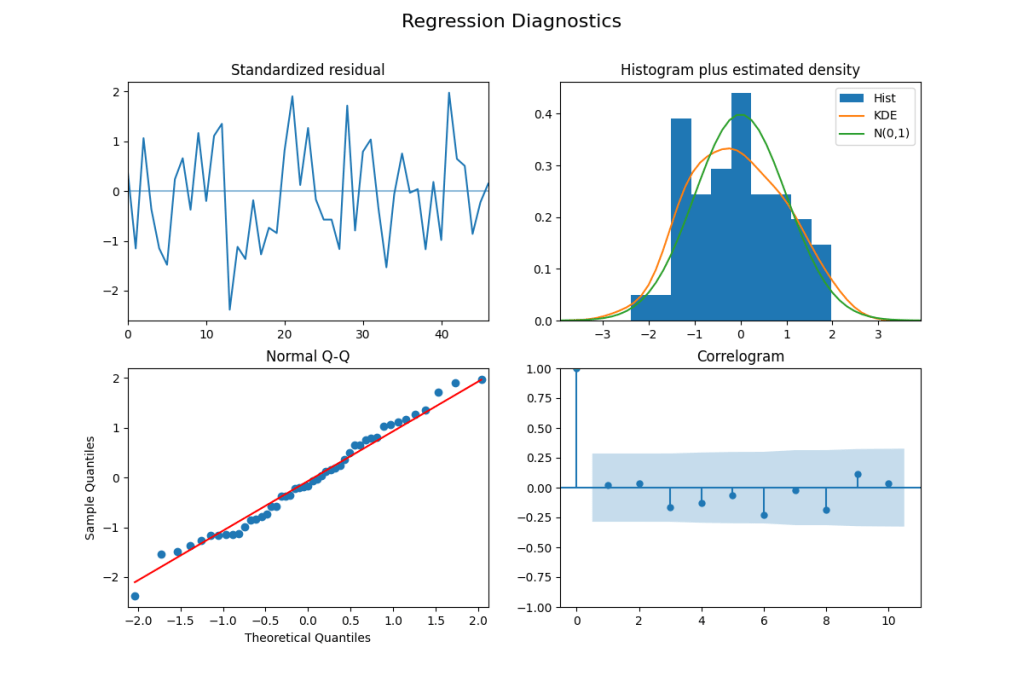
The regression diagnostics indicate that the model is not missing any major dynamics in the data. The standardized residuals are centered on zero, and do not show significant autocorrelation. The residuals are also approximately normally distributed, both from the histogram and the Q-Q plot. None of the lags on the Correlogram are statistically significant.

Leave a comment