I’m back with an update on Pedestrian-Traffic Incidents for the month of October. The data is sourced from the City of Calgary’s open data website. The data set is here.
In this update I’ll give a little more background on the data collection process. I wrote a python script that is scheduled to run on the first of every month. The script uses the SODA API to download all traffic incidents in the preceding month from the City of Calgary’s website, it then extracts any incident with a description that contains ‘pedestrian’. This smaller data set is then aggregated by month-this is the data that you see in the time series plots below.
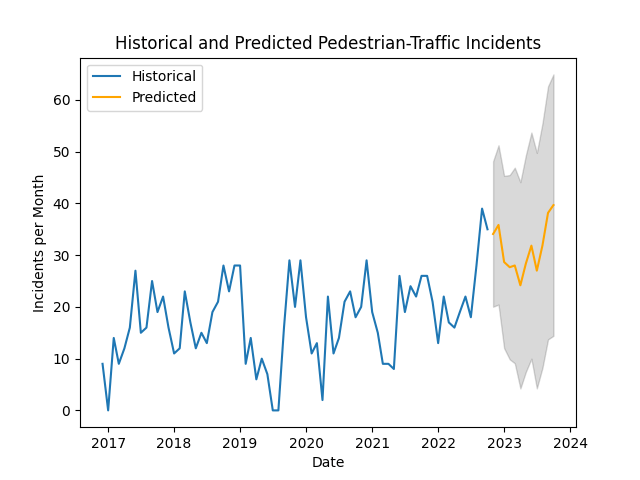
Incidents decreased from their high of 39 in September to 35 in October-9 more than October 2021.
I have also added a map of all incidents to the analysis.
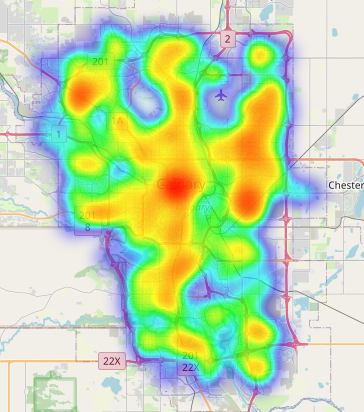
The highest concentration of incidents is downtown, with a branch extending along the Northeast transit line. In future posts I will be working to make this map more dynamic-it would be interesting to know if the incidents downtown decrease on weekends.
Model Details
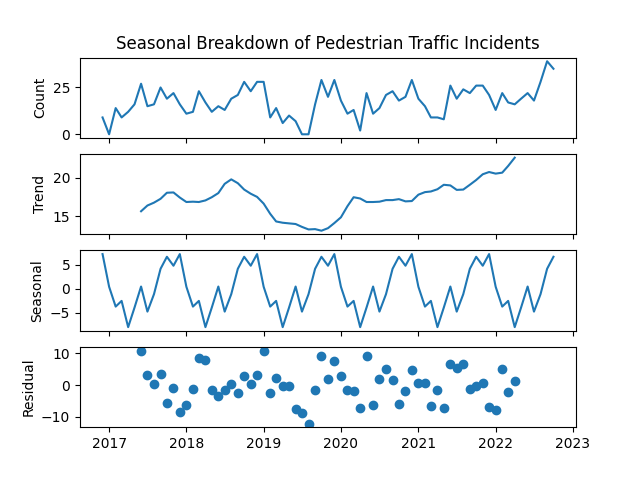
The model is a SARIMAX (Seasonal Auto-Regressive Integrated Moving Average eXogenous regressors). The model specification is (0, 1, 1)(0, 1, 1)[12] An Error-Trend-Seasonal breakdown is shown below:
Regression diagnostics are shown below:
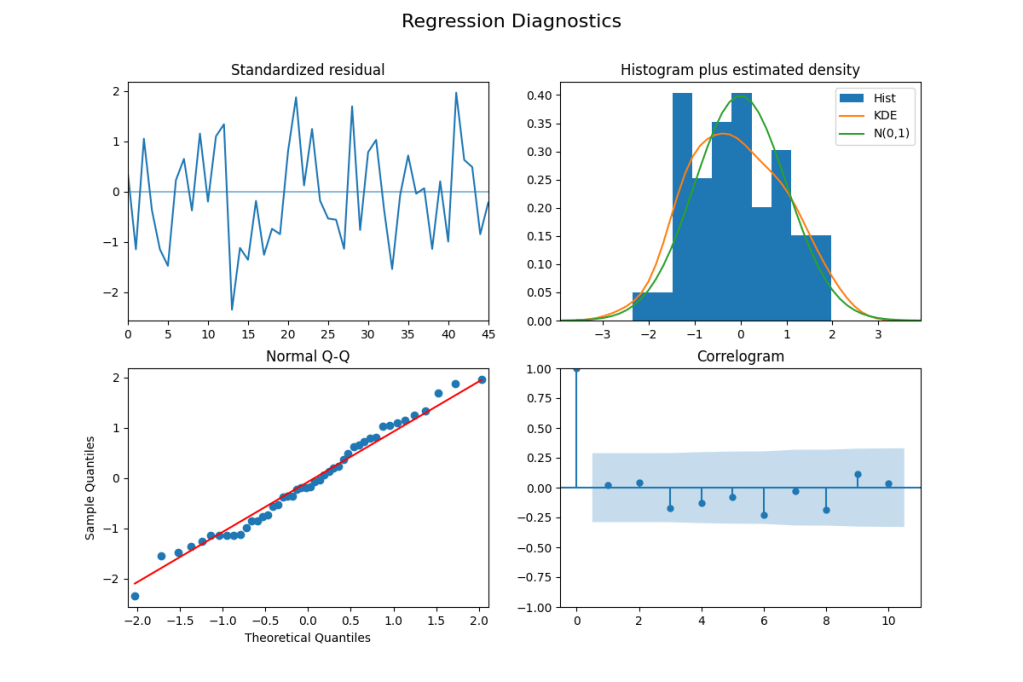
The regression diagnostics indicate that the model is not missing any major dynamics in the data. The standardized residuals are centered on zero, and do not show significant autocorrelation. The residuals are also approximately normally distributed, both from the histogram and the Q-Q plot. None of the lags on the Correlogram are statistically significant.

Leave a comment